
01
TNB Analysis (Free of Charge)
We review your TNB bills under Bukan Domestik ToU Voltan Sederhana—tariff, demand, and trends—and share a free report with initial findings.
A data-driven approach using your real TNB bills and meter data to pinpoint cost reduction—right-sized measures that lower spend without oversizing equipment.
Connected facilities can also use AI-assisted insights in the Energy Portal to screen opportunities, explain cost drivers, and suggest practical next steps.
Industrial and commercial facilities in Malaysia
Our free TNB analysis and cost-reduction programme is built for commercial and industrial accounts on Malaysia’s medium-voltage time-of-use tariff—not domestic or low-voltage rates.
Tariff category: Bukan Domestik ToU Voltan Sederhana
Our approach
From your TNB bills to measurable savings—three structured stages, supported by AI-assisted portal insights when your data is connected.
We review your TNB bills under Bukan Domestik ToU Voltan Sederhana—tariff, demand, and trends—and share a free report with initial findings.
We study main and sub-meter parameters to build an accurate load profile from your facility, not assumptions—ready for AI-assisted pattern screening in the portal.
We propose and implement measures matched to your profile, with ongoing portal monitoring and AI-supported review of new savings opportunities after installation.
You share TNB bills; we return structured analysis you can act on—and connect to ongoing AI-assisted review where meter data is available.
Tariff class, kW demand, peak/off-peak kWh, and charges.
AI can flag demand spikes, tariff mismatches, and abnormal billing trends for follow-up.
TNB
Bil Elektrik
07/04/2026
•••• 4821
Bukan Domestik ToU · Voltan Sederhana
Ringkasan bil (RM)
Interval meter — total power
07/04/2026 · 1-min readings (sample)
Summary findings, trends, and recommended next steps.
Report findings can feed portal Q&A on load shifting, MD reduction, BESS, solar, and retrofit screening.
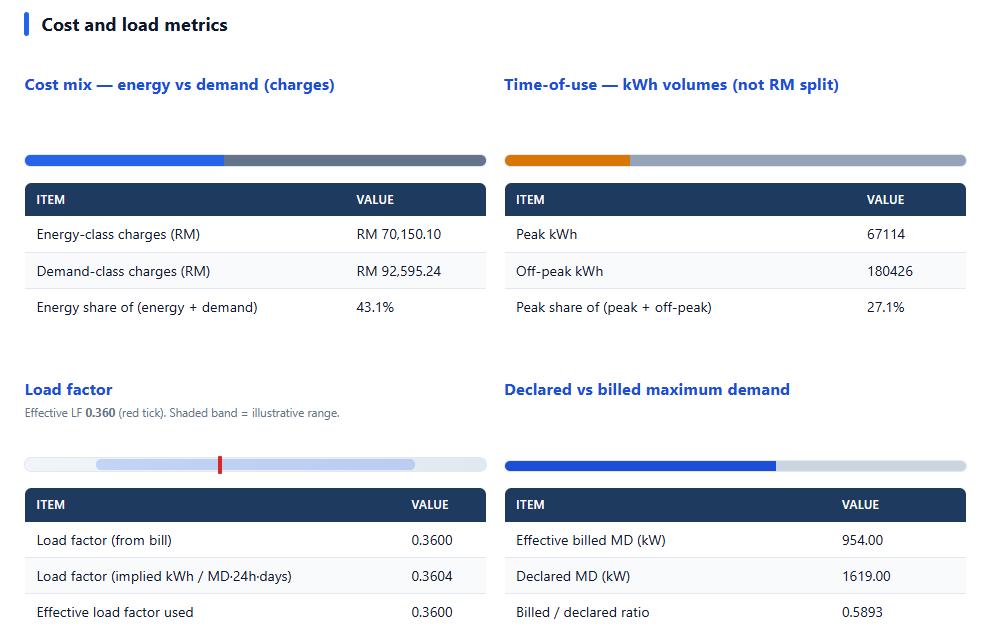
Cost and load metrics
Cost mix — energy vs demand (charges)
| Energy-class charges | RM 70,150 |
| Demand-class charges | RM 92,595 |
| Energy share | 43.1% |
Time-of-use — kWh volumes (not RM split)
| Peak kWh | 67,114 |
| Off-peak kWh | 180,426 |
| Peak share | 27.1% |
Load factor
| Load factor (from bill) | 0.3600 |
| Load factor (implied) | 0.3604 |
| Effective load factor used | 0.3600 |
Declared vs billed maximum demand
| Effective billed MD | 954.00 kW |
| Declared MD | 1619.00 kW |
| Billed/declared ratio | 0.5893 |
AI-backed monitoring layer
From monitoring data to practical questions, answers, and next actions.
Once bills and meter data are connected, the portal helps users move from raw readings to business decisions. The AI layer can review consumption, demand, time-of-use patterns, meter composition, and cost drivers, then suggest where deeper engineering review or cost-reduction action may be required.
Screen for maximum demand reduction, load shifting, BESS feasibility, solar optimization, and efficiency retrofit potential.
Break down energy charges, demand charges, peak/off-peak usage, load factor, and abnormal trends in plain language.
Help management understand whether the next step should be bill review, meter analysis, onsite study, or implementation.
Create an ongoing digital touchpoint instead of a one-time report, so savings opportunities can be reviewed continuously.
Bao Energy Portal · AI Insights
Connected to facility meter data
User
Can we reduce maximum demand without affecting production?
AI insight
Your recent load profile shows repeated short peak periods instead of a full-day high-load pattern. This may indicate load shifting or peak shaving potential. Recommended next step: review coincident meter contribution during the demand window and identify flexible loads before proposing equipment changes.
Peak demand detected
Meter contribution ranked
Next action suggested
AI insights are used to support engineering review, not replace onsite assessment.
Loading dashboard…
Share your recent TNB bills and facility context—we will return a professional summary with no obligation.
Strong candidates for portal AI review are also identified when deeper meter data or ongoing monitoring may add value.
Request free TNB analysis